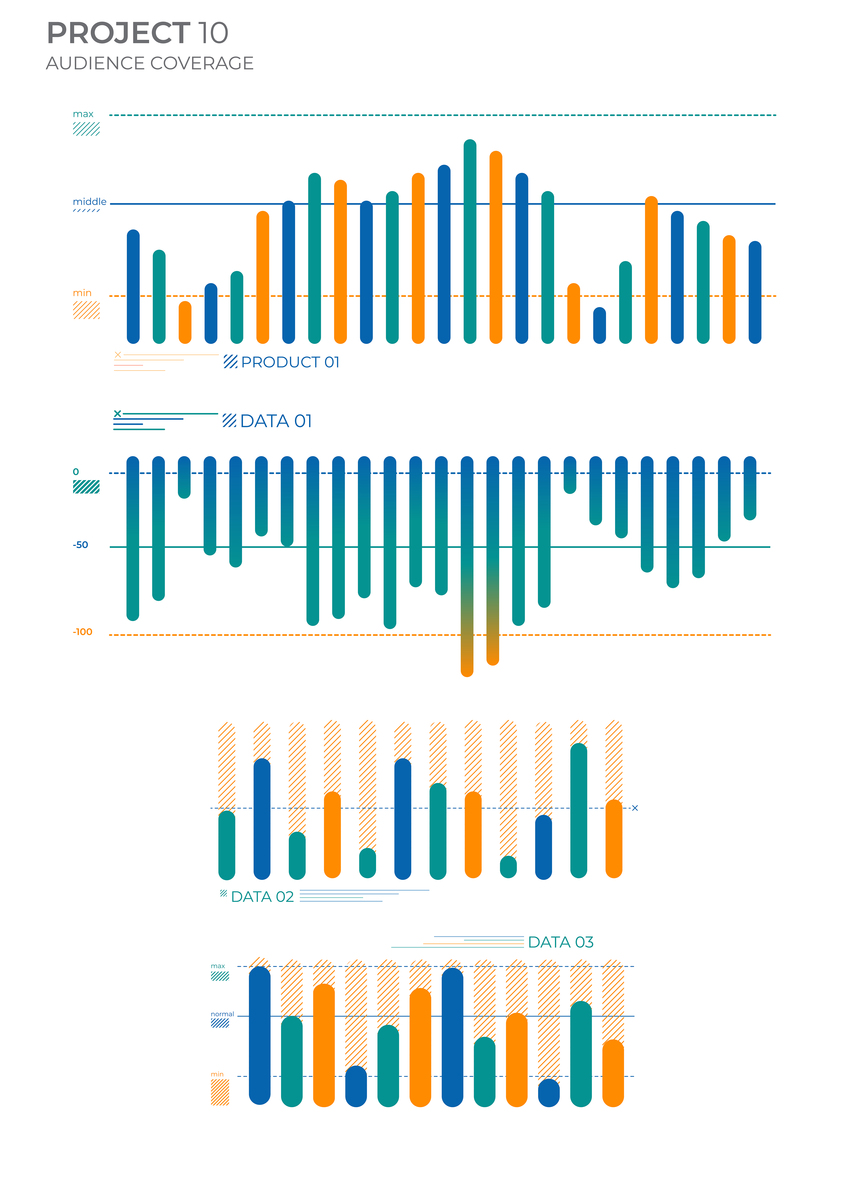
ECharts 柱状图虚线图例设置教程
要在 ECharts 中设置柱状图的虚线图例,可以使用 'series' 中的 'itemStyle' 属性来设置柱状图的样式。具体的步骤如下:
- 在 ECharts 的配置项中,找到 'series' 数组,然后在数组中添加一个对象,表示要绘制的柱状图。
series: [
    {
        name: '柱状图名称',
        type: 'bar',
        data: [/* 柱状图数据 */],
        itemStyle: {
            normal: {
                lineStyle: {
                    type: 'dashed' // 设置虚线样式
                }
            }
        }
    }
]
- 在 'itemStyle' 中的 'normal' 属性下,设置 'lineStyle' 的 'type' 属性为 'dashed',表示要绘制虚线样式。
这样就可以在 ECharts 中设置柱状图的虚线图例了。

原文地址: https://www.cveoy.top/t/topic/qBkq 著作权归作者所有。请勿转载和采集!