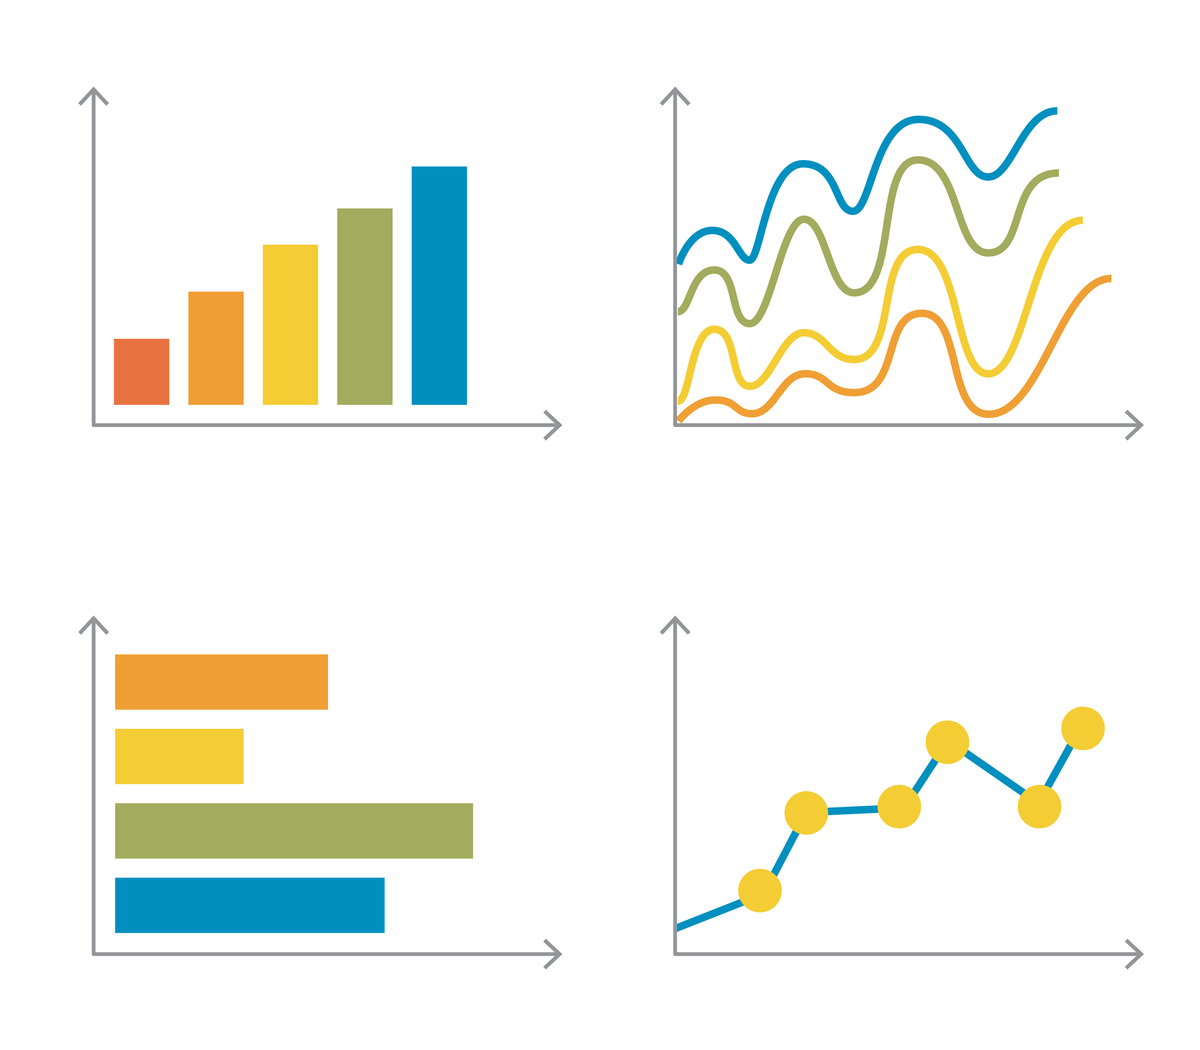
Echarts 行情展示图表:折线图与柱状图组合示例
<div id='chart' style='width: 800px; height: 400px;'></div>
<script>
    // 基于准备好的dom,初始化echarts实例
    var myChart = echarts.init(document.getElementById('chart'));
<pre><code>// 指定图表的配置项和数据
var option = {
    title: {
        text: '股票价格趋势与成交量'
    },
    tooltip: {
        trigger: 'axis'
    },
    legend: {
        data: ['价格', '成交量']
    },
    grid: {
        left: '3%',
        right: '4%',
        bottom: '10%',
        containLabel: true
    },
    xAxis: {
        type: 'category',
        boundaryGap: false,
        data: ['01/01', '01/02', '01/03', '01/04', '01/05', '01/06', '01/07']
    },
    yAxis: [{
        type: 'value',
        name: '价格',
        axisLabel: {
            formatter: '{value} 元'
        }
    }, {
        type: 'value',
        name: '成交量',
        axisLabel: {
            formatter: '{value} 手'
        }
    }],
    series: [{
        name: '价格',
        type: 'line',
        data: [120, 132, 101, 134, 90, 230, 210]
    }, {
        name: '成交量',
        type: 'bar',
        yAxisIndex: 1,
        barWidth: 3,
        data: [220, 182, 191, 234, 290, 330, 310]
    }]
};

// 使用刚指定的配置项和数据显示图表。
myChart.setOption(option);
</code></pre>
</script>

原文地址: https://www.cveoy.top/t/topic/ok0n 著作权归作者所有。请勿转载和采集!