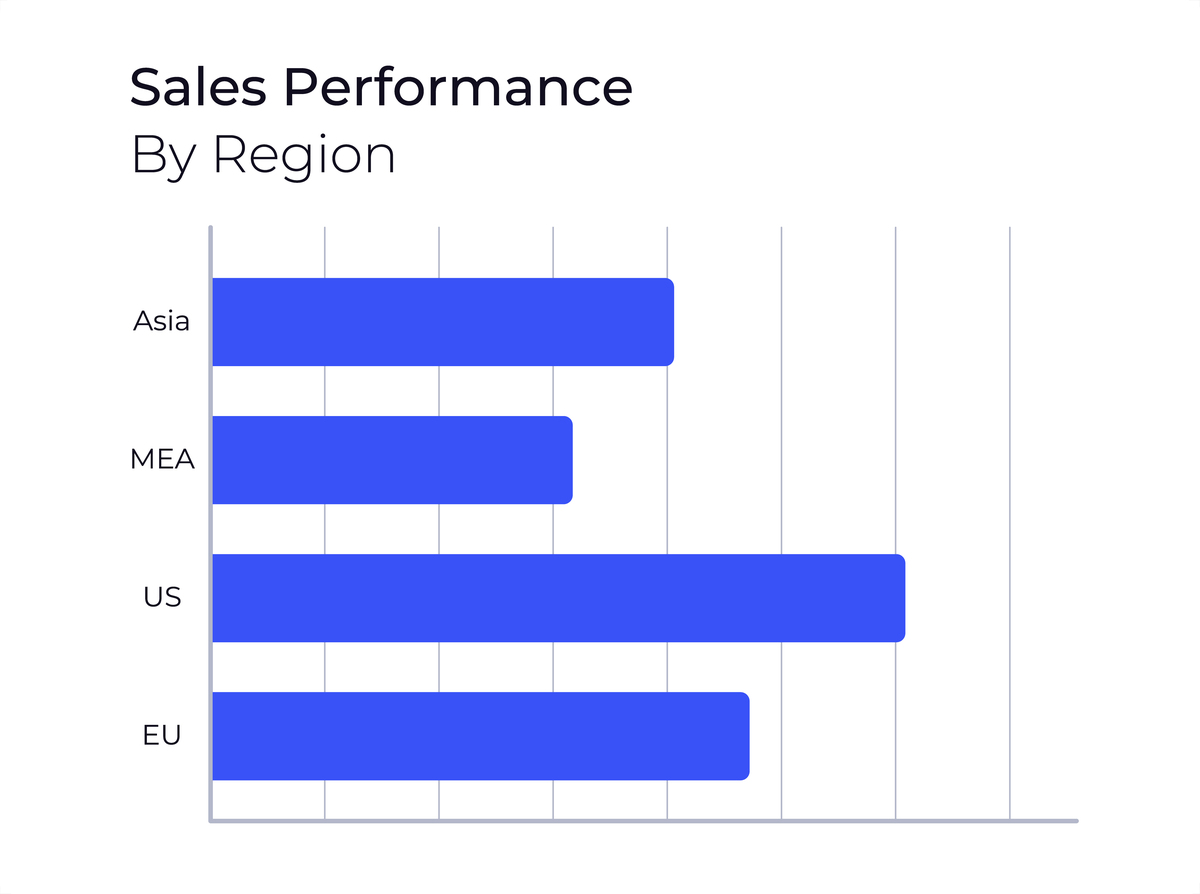
Echarts 柱状图颜色设置方法详解
该统计图的颜色可以在series中的itemStyle中进行设置,如下所示:
 series: [{
    name: '销量',
    type: 'bar',
    data: [5, 20, 36, 10, 10, 20],
    itemStyle: {
        color: '#c23531'  //设置颜色为红色
    }
}]
也可以在全局中设置颜色,如下所示:
option = {
    color: ['#c23531', '#2f4554', '#61a0a8', '#d48265', '#91c7ae', '#749f83'],
    //...
};
其中color为一个数组,可以设置多个颜色,每个系列的颜色会按顺序循环使用。

原文地址: https://www.cveoy.top/t/topic/n5fF 著作权归作者所有。请勿转载和采集!