Python关键词提取、词性筛选、词频统计及词云图绘制
使用Python提取中文文本关键词并绘制词云图
本文将介绍如何使用Python提取中文文本关键词,并进行词性筛选、词频统计,最终绘制并保存频次图和词云图。
1. 安装必要库
关键词提取和词性筛选需要使用自然语言处理相关的库,如jieba和nltk,绘制词云图需要使用wordcloud库。
pip install jieba
pip install nltk
pip install wordcloud
2. 代码实现
import jieba
from nltk import pos_tag
import wordcloud
import matplotlib.pyplot as plt
from PIL import Image
import numpy as np

# 加载停用词表
stopwords_path = '哈工大停用词表.txt'
stopwords = set()
with open(stopwords_path, 'r', encoding='utf-8') as f:
    for line in f:
        stopwords.add(line.strip())

# 加载文本文件
filename = 'text.txt'
with open(filename, 'r', encoding='utf-8') as f:
    text = f.read()

# 对文本进行分词和词性标注
words = jieba.cut(text)
words = [word for word in words if word not in stopwords and word != '']
words_pos = pos_tag(words)

# 筛选名词
nouns = [word for word, pos in words_pos if pos.startswith('N')]

# 统计词频
freq = {}
for word in nouns:
    freq[word] = freq.get(word, 0) + 1

# 绘制频次图
plt.bar(range(len(freq)), list(freq.values()), align='center')
plt.xticks(range(len(freq)), list(freq.keys()), rotation=90)
plt.xlabel('Keyword')
plt.ylabel('Frequency')
plt.title('Keyword Frequency')
plt.savefig('freq.png', dpi=300)
plt.show()

# 绘制词云图
mask = np.array(Image.open('mask.png'))
wc = wordcloud.WordCloud(background_color='white', mask=mask)
wc.generate_from_frequencies(freq)
plt.imshow(wc, interpolation='bilinear')
plt.axis('off')
plt.savefig('wordcloud.png', dpi=300)
plt.show()
3. 文件说明
text.txt: 待处理的文本文件哈工大停用词表.txt: 可在网上搜索下载mask.png: 词云图的形状图片
4. 运行结果
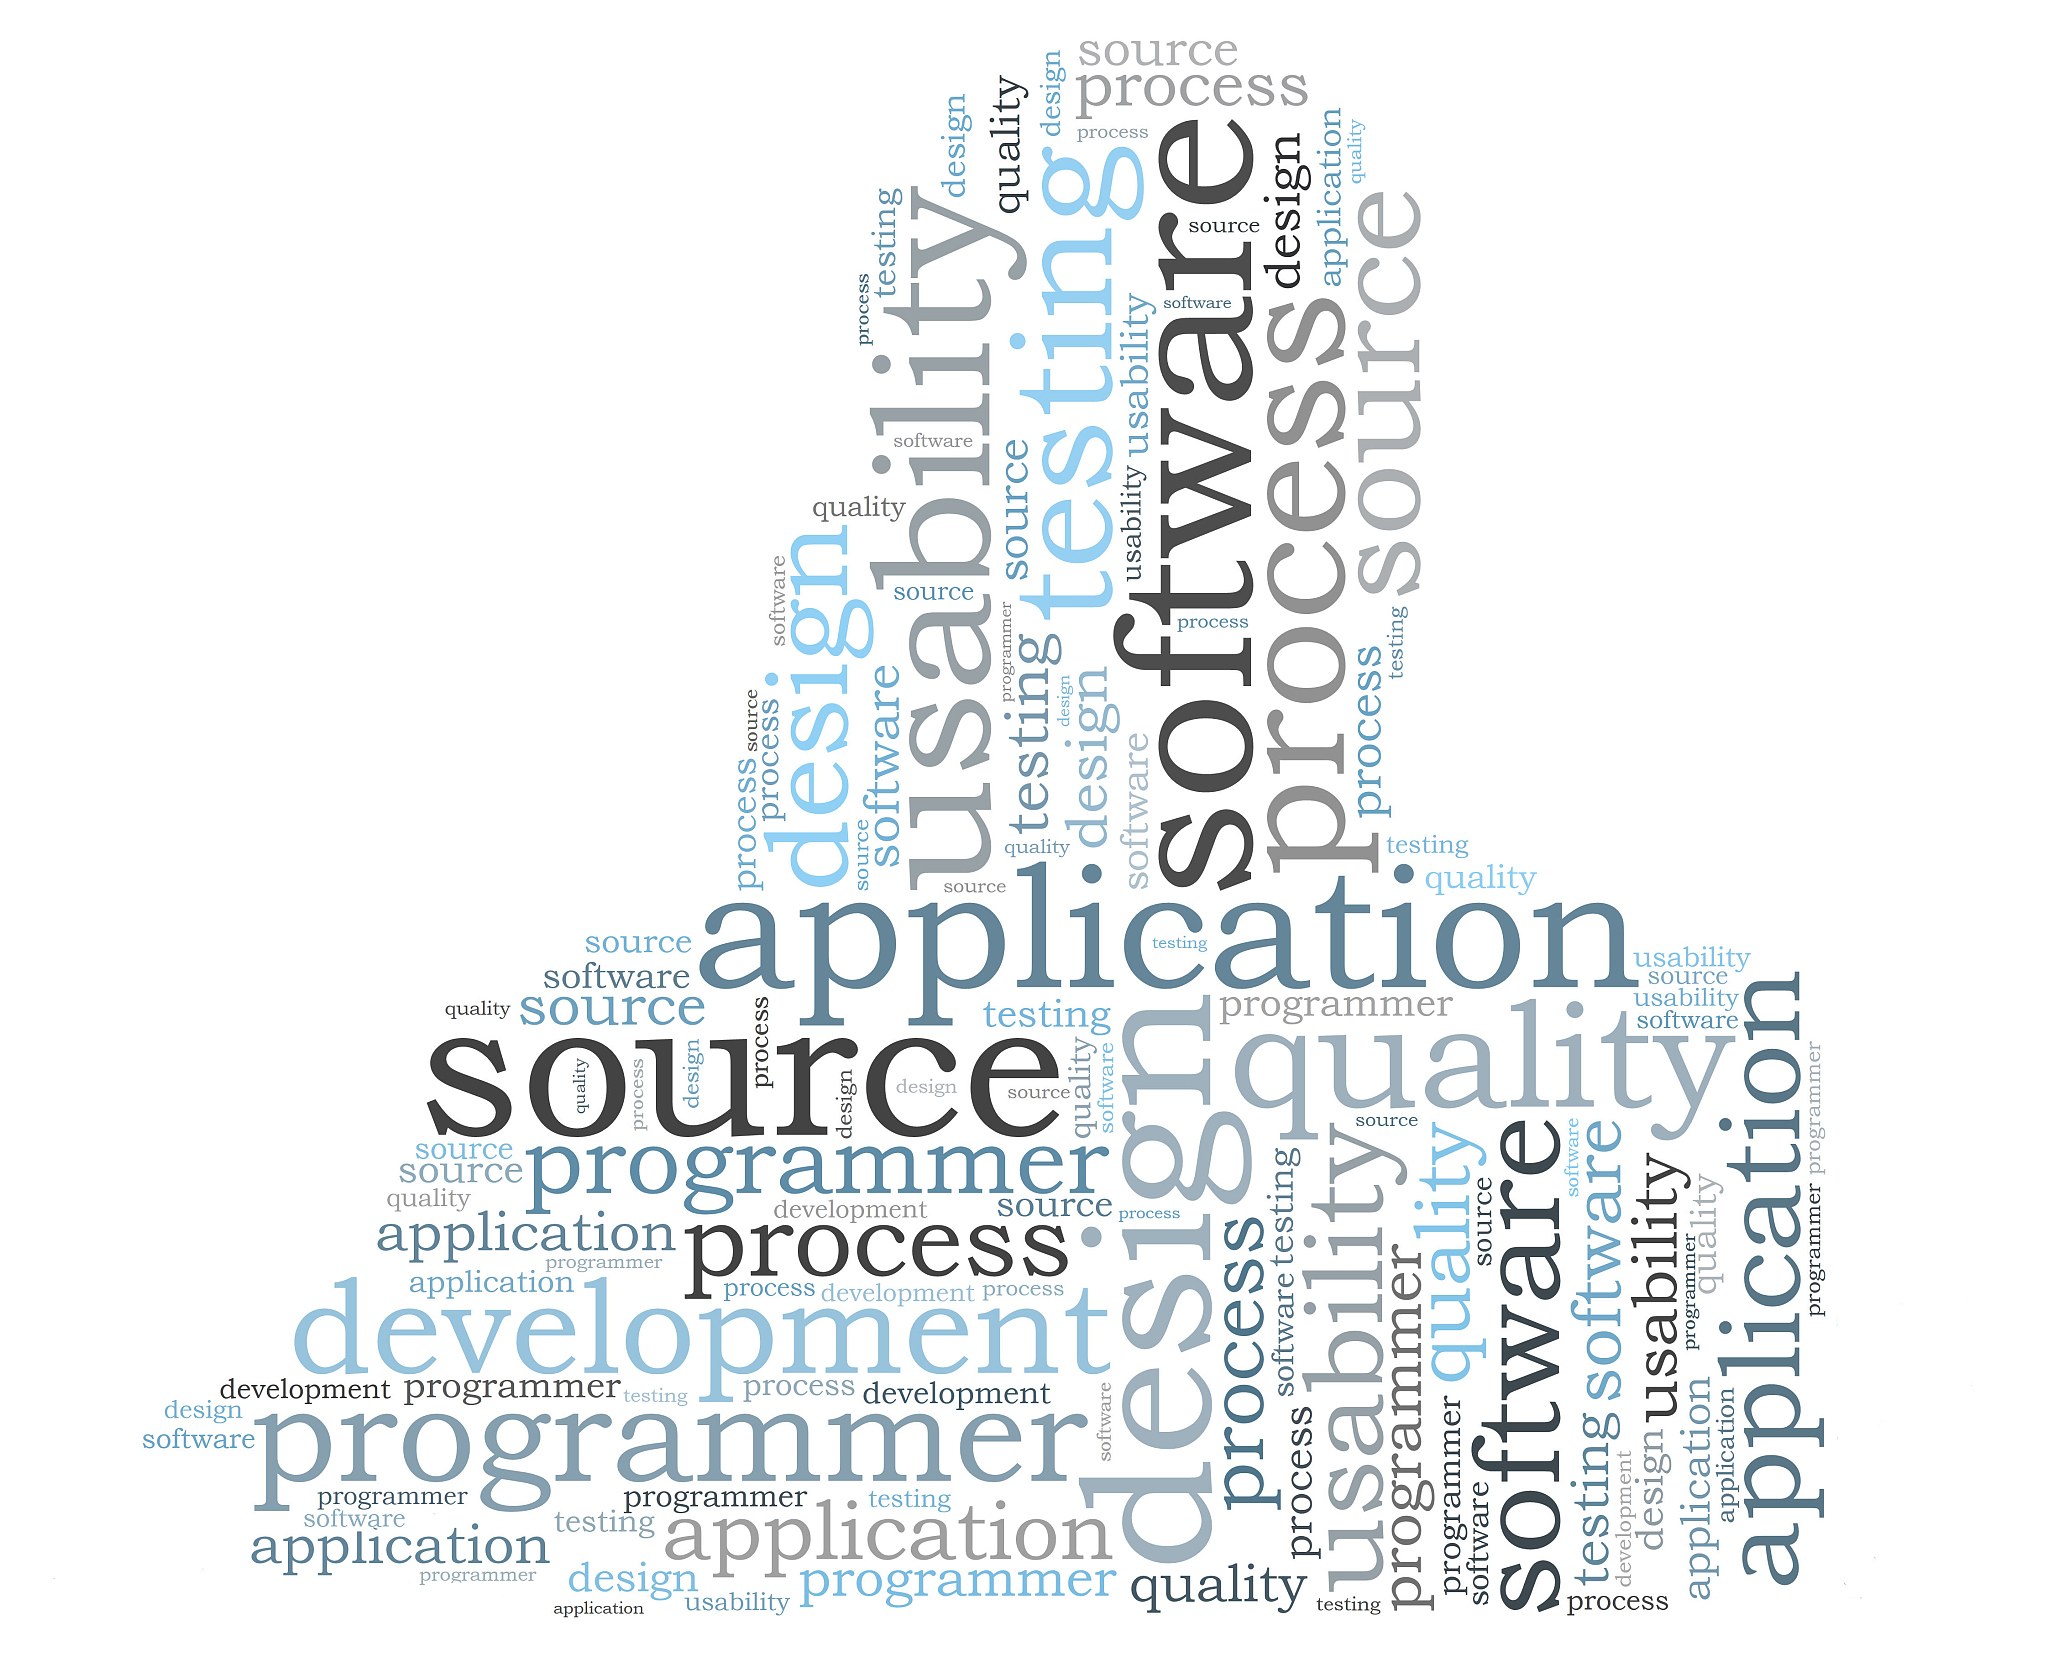
运行代码后,会生成 freq.png 和 wordcloud.png 两个文件,分别为关键词的频次图和词云图。
5. 总结
本文介绍了使用Python提取中文文本关键词,并进行词性筛选、词频统计,最终绘制并保存频次图和词云图的方法。该方法简单易懂,可用于分析文本数据,提取关键信息。
原文地址: https://www.cveoy.top/t/topic/n2NR 著作权归作者所有。请勿转载和采集!