AntV 柱状图上添加文字:详解步骤与代码示例
在 AntV 中,可以使用 Geom.Text 组件在柱状图上方添加文字。以下是一步一步的实现步骤和代码示例:
-
添加 Geom.Text 组件
在柱状图的代码中,添加 Geom.Text 组件,并将文本内容设置为需要显示的内容。例如:
chart.interval().position('year*sales').color('category').label('sales', { offset: 10, // 文字距离柱子的距离 style: { fill: '#fff' // 文字颜色 } }); -
设置文本位置
使用
position方法来设置文本的位置,例如:.position('year*sales')year和sales分别是 x 轴和 y 轴的字段名,可以根据实际情况进行修改。 -
设置文本样式
使用
style方法来设置文本的样式,例如:.style({ fill: '#fff' })这里设置文本颜色为白色。
-
设置文本偏移量
使用
label方法来设置文本的偏移量,例如:.label('sales', { offset: 10 })这里设置文本距离柱子的距离为 10。
完整代码示例:
import { Chart, Geom, Axis, Tooltip } from '@antv/g2';

const data = [
  { year: '2014', sales: 1000, category: '电视' },
  { year: '2015', sales: 1170, category: '电视' },
  { year: '2016', sales: 660, category: '电视' },
  { year: '2017', sales: 1030, category: '电视' },
  { year: '2014', sales: 400, category: '手机' },
  { year: '2015', sales: 460, category: '手机' },
  { year: '2016', sales: 1120, category: '手机' },
  { year: '2017', sales: 540, category: '手机' },
  { year: '2014', sales: 300, category: '笔记本' },
  { year: '2015', sales: 380, category: '笔记本' },
  { year: '2016', sales: 640, category: '笔记本' },
  { year: '2017', sales: 320, category: '笔记本' },
];

const chart = new Chart({
  container: 'container',
  forceFit: true,
  height: 400,
});

chart.source(data);

chart.interval().position('year*sales').color('category').label('sales', {
  offset: 10,
  style: {
    fill: '#fff'
  }
});

chart.render();
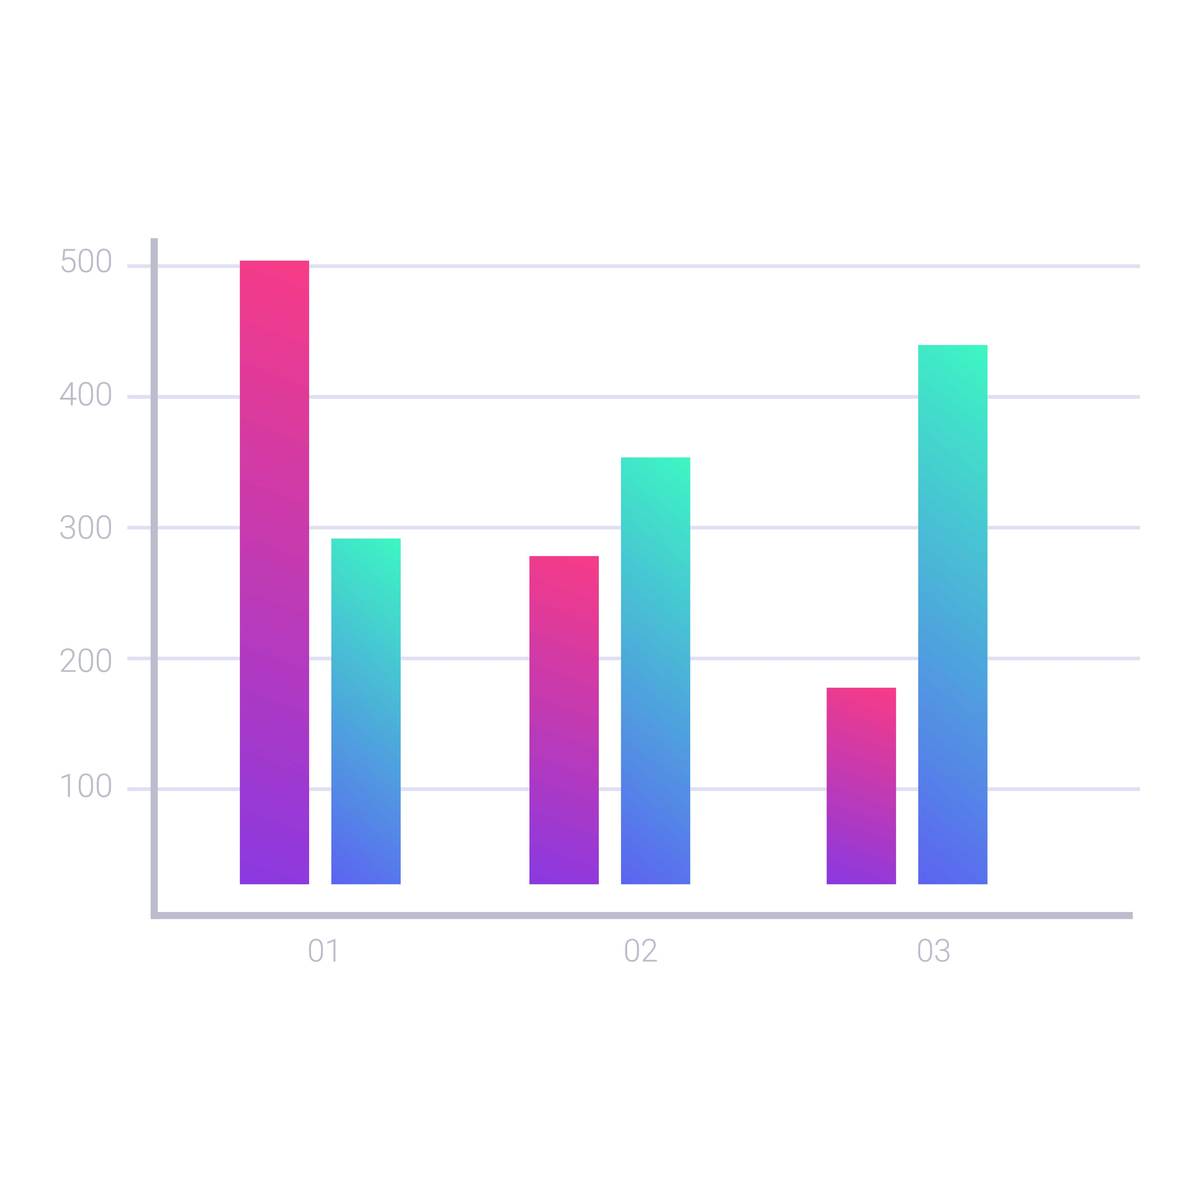
运行后,你将在柱状图上方看到添加的文字信息。
原文地址: https://www.cveoy.top/t/topic/mQcJ 著作权归作者所有。请勿转载和采集!