AntV G2Plot 条形图渐变色填充教程
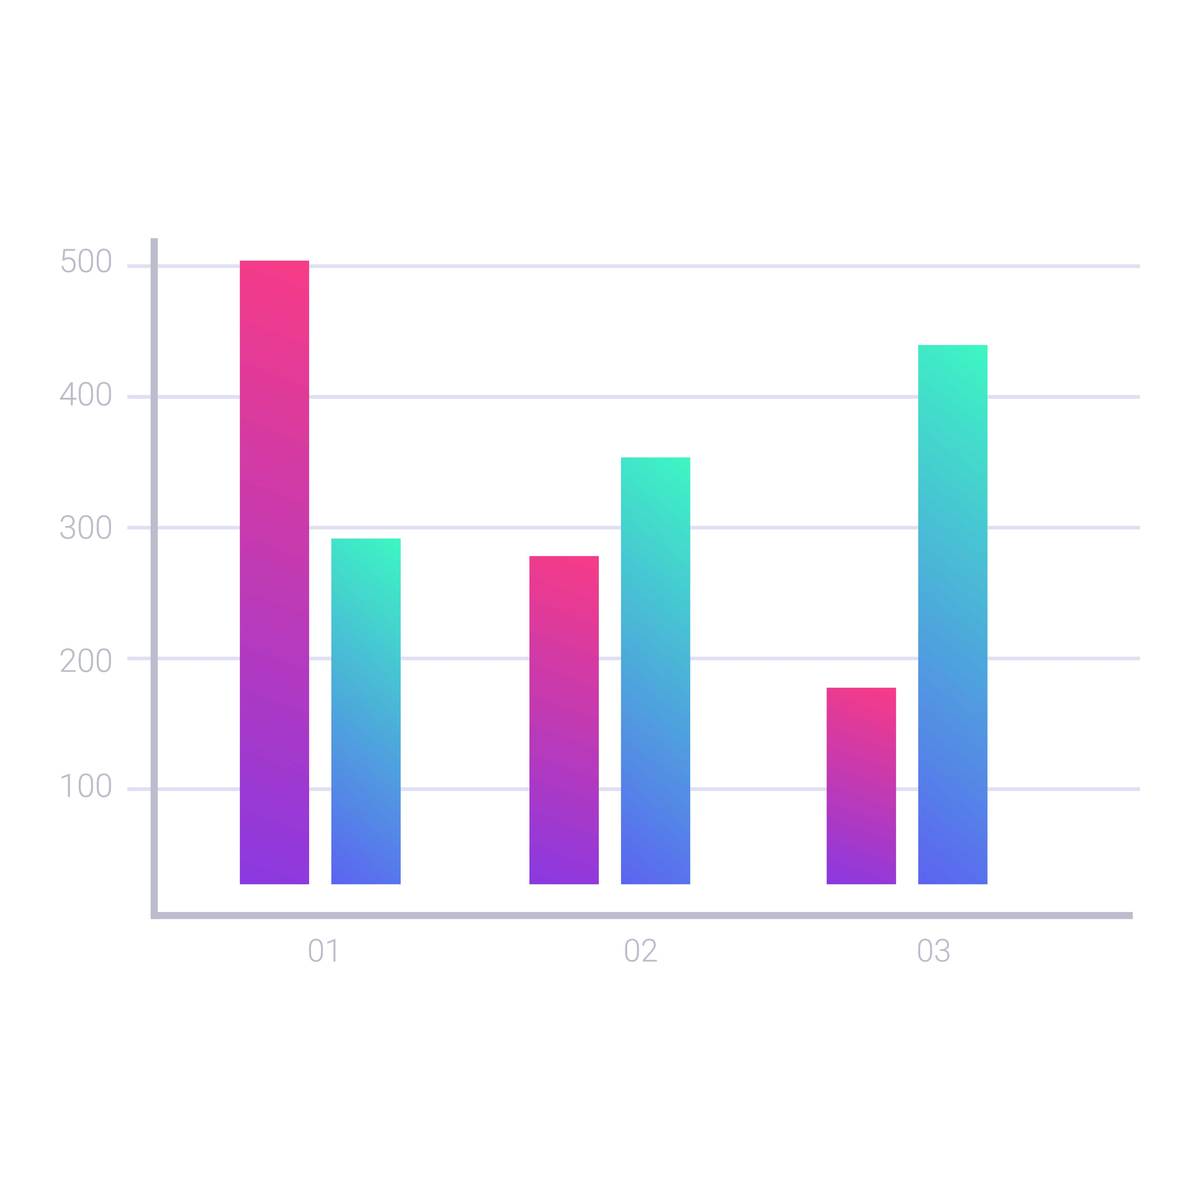
在 AntV G2Plot 中,可以使用渐变色填充来美化条形图。
我们可以通过以下步骤来实现:
-
定义渐变色,可以使用 'linear-gradient' 或 'radial-gradient' 函数,例如:'linear-gradient(to right, #00c6ff, #0072ff)' 表示从左到右的线性渐变色。
-
在条形图的样式中,设置 'color' 为渐变色,并将 'colorField' 设置为条形图的数据字段。
-
如果需要不同的渐变色填充不同的条形,可以在数据中添加一个字段用于指定渐变色的类型,然后在样式中使用 'colorField' 指定该字段。
以下是一个示例代码:
import { Bar } from '@antv/g2plot';

const data = [
  { year: '1月', sales: 38, type: 'A' },
  { year: '2月', sales: 52, type: 'B' },
  { year: '3月', sales: 61, type: 'C' },
  { year: '4月', sales: 145, type: 'A' },
  { year: '5月', sales: 48, type: 'B' },
  { year: '6月', sales: 38, type: 'C' },
  { year: '7月', sales: 38, type: 'A' },
  { year: '8月', sales: 38, type: 'B' },
  { year: '9月', sales: 38, type: 'C' },
  { year: '10月', sales: 38, type: 'A' },
  { year: '11月', sales: 38, type: 'B' },
  { year: '12月', sales: 38, type: 'C' },
];

const colors = {
  A: 'linear-gradient(to right, #00c6ff, #0072ff)',
  B: 'linear-gradient(to right, #f12711, #f5af19)',
  C: 'linear-gradient(to right, #f12711, #f5af19)',
};

const barPlot = new Bar('container', {
  data,
  xField: 'year',
  yField: 'sales',
  colorField: 'type',
  color: (d) => colors[d],
});

barPlot.render();
这里的 'colors' 对象指定了不同类型的渐变色,然后在样式中使用 'colorField' 指定 'type' 字段,然后使用函数返回对应类型的渐变色。
原文地址: https://www.cveoy.top/t/topic/lUHQ 著作权归作者所有。请勿转载和采集!