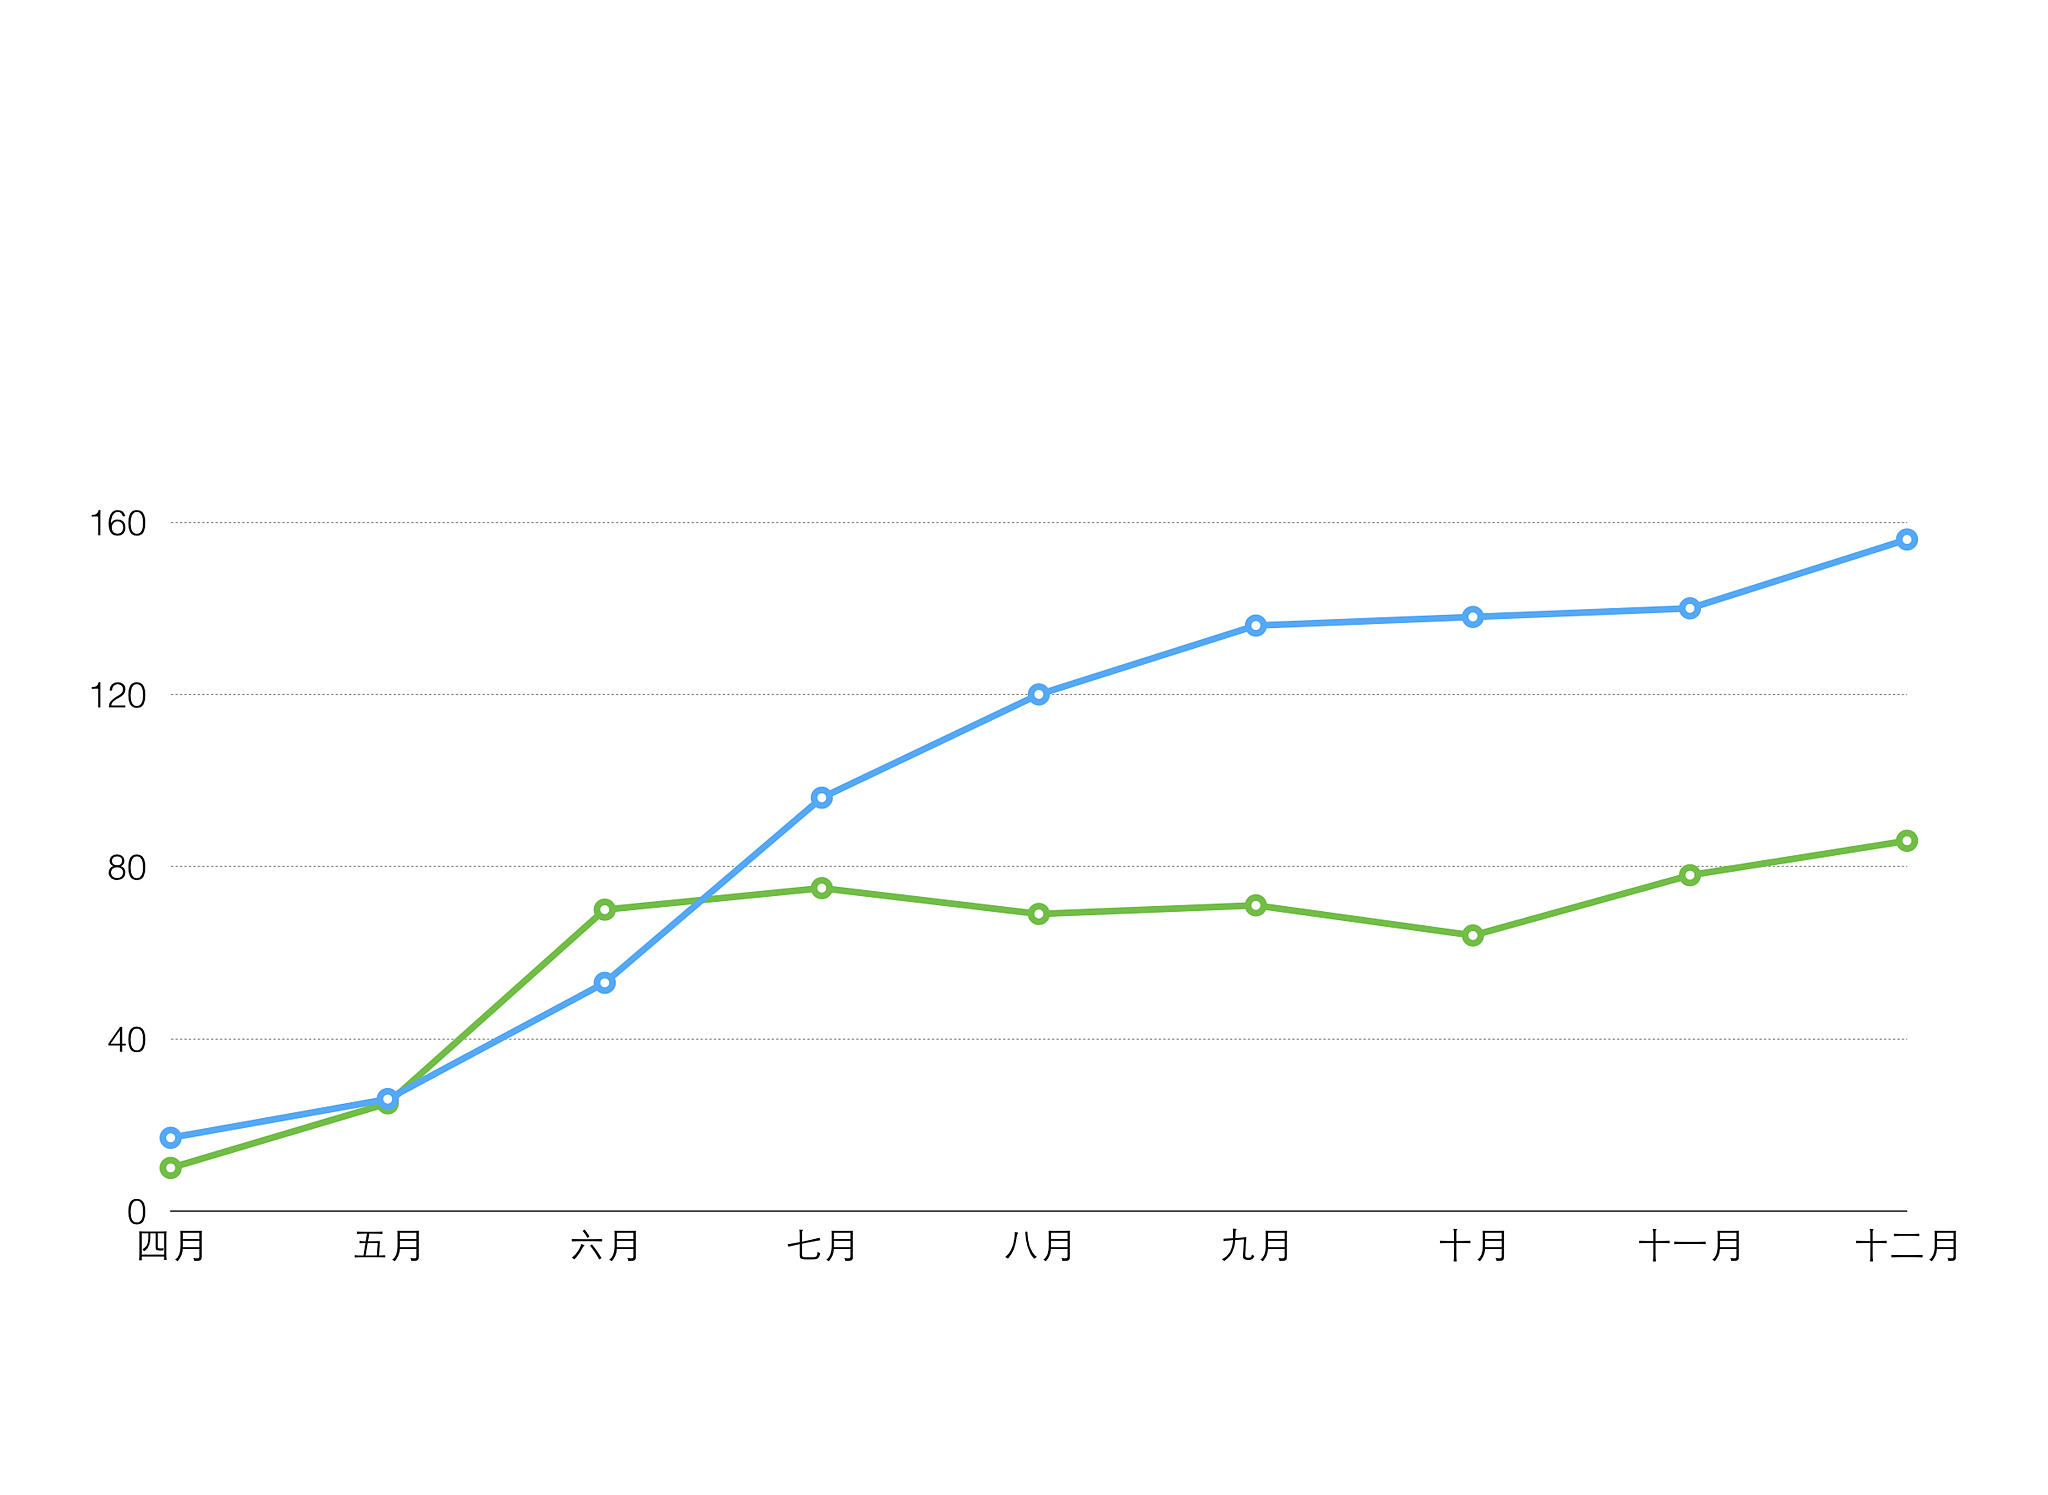
salesxlsx中的数据是某企业的销售数据请绘制销售量和销售金额的折线图。使用matlab写出上述问题的代码
load sales.xlsx sales = table2array(sales); dates = datetime(sales(:,1),'ConvertFrom','Excel'); sales_amount = sales(:,2); sales_quantity = sales(:,3);
%绘制销售量和销售金额的折线图 subplot(2,1,1) plot(dates,sales_quantity,'-o','LineWidth',1.5,'MarkerSize',5,'MarkerEdgeColor','k','MarkerFaceColor','r') title('Sales Quantity') xlabel('Date') ylabel('Quantity') subplot(2,1,2) plot(dates,sales_amount,'-o','LineWidth',1.5,'MarkerSize',5,'MarkerEdgeColor','k','MarkerFaceColor','r') title('Sales Amount') xlabel('Date') ylabel('Amount'
原文地址: https://www.cveoy.top/t/topic/frih 著作权归作者所有。请勿转载和采集!