echarts设置柱状图的柱子宽度
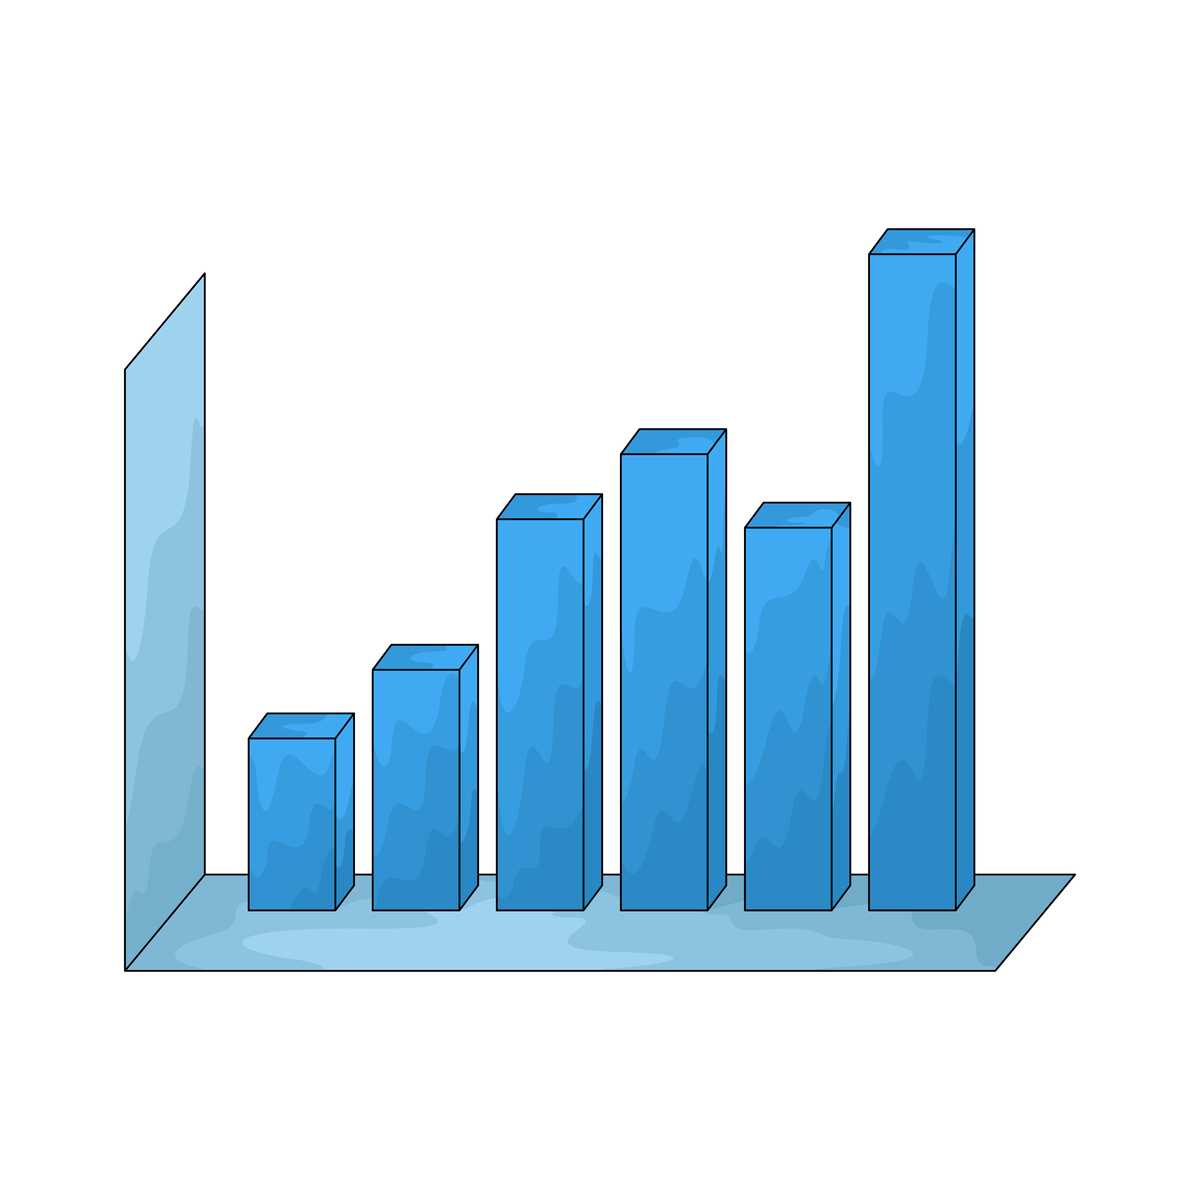
在ECharts中,可以通过设置series中的barWidth属性来调整柱状图的柱子宽度。barWidth属性的值可以是具体的像素值,也可以是百分比。以下是设置柱子宽度的示例代码:
option = {
  xAxis: {
    type: 'category',
    data: ['A', 'B', 'C', 'D', 'E']
  },
  yAxis: {
    type: 'value'
  },
  series: [{
    type: 'bar',
    data: [100, 200, 300, 400, 500],
    barWidth: 30 // 设置柱子宽度为30像素
  }]
};
在上述代码中,通过设置series中的barWidth属性为30,即可将柱子宽度设置为30像素。如果需要将柱子宽度设置为百分比,可以使用字符串形式的百分比值,例如barWidth: '50%'。
原文地址: http://www.cveoy.top/t/topic/iVk1 著作权归作者所有。请勿转载和采集!